The Principal Component Analysis (PCA) is a novel scenario-building method developed by Futures Platform.
Method
Principal Component Analysis (PCA) is a novel explorative-inductive scenaring method developed by Futures Platform. It is used to create a set of scenarios that maximises three criteria: diversity, plausibility and coherence. The analysis method derives from Principal Component Analysis (PCA), which is an applied statistical method for multidimensional data, originally created by Pearson (1901). Thus, we use the same name for our method.
In our case, we don’t work with actual datasets as in the original statistical method but assume that the set of all possible future states can be characterised by specific relationships between different variables affecting the outcome. Thus, we utilise the scarce knowledge we have about the future to the maximum. The analysis process is relatively simple, and the quantitative results are easily readable in a visualised format.
As a scenario-building tool, PCA has several strengths compared to the closely related Morphological analysis with Field Anomaly Relaxation or Futures Table methods. Firstly, it eliminates all randomness related to the selection of the level combinations of uncertainties. Secondly, it allows factoring in more uncertainties without much additional workload. Third, it provides a maximally diverse set of scenarios so that the results are not just variations on similar themes. Lastly, it ensures that the spectrum of possibilities is maximally covered with a minimal number of scenarios.
The analysis process
Uncertainties
In scenario building, the key assumption is that the future state is determined by the development of a set of different uncertain factors or variables. The most suitable number of variables depends on the context, but it has to cover all significant change drivers, phenomena, trends, change blockers, events, etc., that have a substantial effect on the topic under analysis. A suitable number could vary from 6 to 10.
Hereinafter, these factors will simply be called uncertainties, which refers to the uncertainty of their future impact, direction or pace. If we expect to know the development of a future change very well, it means that it’s not an uncertainty and, therefore, shouldn’t be used as a variable in PCA. Many frameworks and heuristics, such as PESTEL, can be used to identify uncertainties.
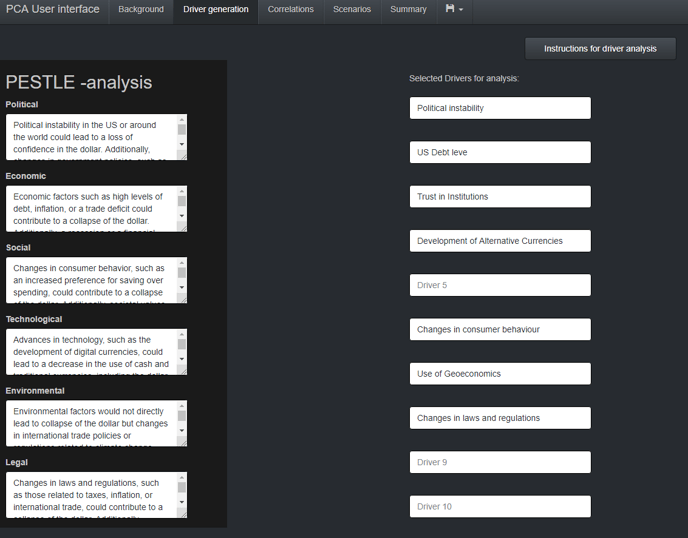
Figure 1: Uncertainties identified through PESTLE analysis on Futures Platform's PCA analysis software
The development of each uncertainty can be represented by a continuous variable varying between a minimum and a maximum development level. The uncertainties do not need to be numerical: qualitatively expressed uncertainties are equally useful as long as they have a direction guaranteeing that they can be interpreted on a scale from minimum to maximum. By choosing a value on this interval for each uncertainty, we get an interpretable state of the world: uncertainty one develops weakly, uncertainty two maximally, etc.
Correlations
We also assume that each uncertainty pair is correlated, meaning they have a statistical dependency. This dependency can be either positive or negative, depending on whether the uncertainties tend to move (or can be assumed to move) in identical or opposite directions.
The correlation varies between -1 and 1, where -1 represents a perfect negative relationship (meaning that the uncertainties always develop in opposite directions) and 1 is a perfect positive relationship (meaning that the uncertainties always develop in identical directions). In practice, the correlation is always something between these two extremes, depending on how strongly their development is linked to each other. A value of zero is also possible, representing that the uncertainties are not statistically dependent on each other. The stronger the correlation, the more likely it is that the direction of development of two uncertainties is identical or reverse, depending on the sign. It is recommended to have at least one negative correlation in the table.
We collect assessments of correlations between all uncertainty pairs and fill them in a table (see figure 2 below). This table is symmetric due to the fact that the correlation is the same regardless of whether it is the correlation between uncertainty 1 and 2 or between 2 and 1. In some cases, correlations can be directly estimated from data, leading to increased accuracy. However, correlations can be qualitatively assessed regardless of whether the uncertainties represent concepts that can easily be quantified. Assessing correlations does not require identifying causal relationships either: a strong correlation does not tell whether uncertainty 1 causes uncertainty 2, whether uncertainty 2 causes uncertainty 1, or whether they have any causal relationship at all. It only represents a statistical dependency. The correlations table can be easily filled in a workshop setting, and also Delphi estimates of correlations can be used.
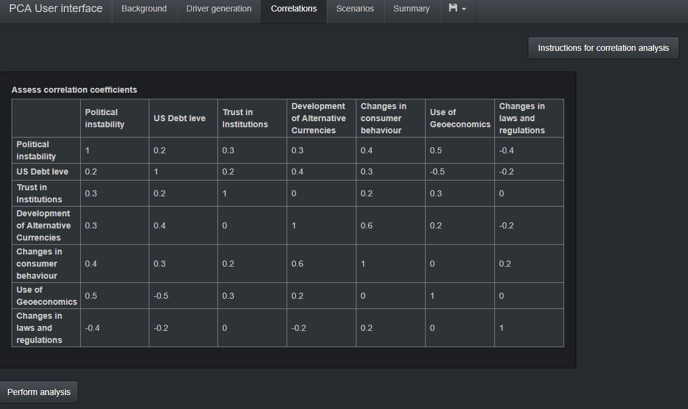 Figure 2: An example of a correlation table
Computation of principal components
After creating the correlation table, the next step is to find a subset of sub-scenarios (small circles in Figure 3) describing the different possible future states in the most plausible and diverse manner given the assumed correlation structure between the uncertainties.
We use Principal Component Analysis (PCA) which identifies orthogonal directions, called principal components, along which the data has the largest variance. By choosing data points along these first two or three directions, we ensure that the set of sub-scenarios is maximally plausible and diverse. We also utilise the variance of each principal component so that each chosen actual scenario (large blue circle in Figure 3) is roughly equally probable. In practice, this is done by using Futures Platform´s statistical software.
The general idea and the end result can be easily shown in the 2D case of two uncertainties (here, two drivers) as in Figure 3, but the same idea can be applied in a more multidimensional case. In PCA, the assumed data (illustrated with the small circles in Figure 3) represents possible future states, and our assessment of the correlation structure is nested in the data. We pick four scenarios in total, represented by the four large blue circles in Figure 3.
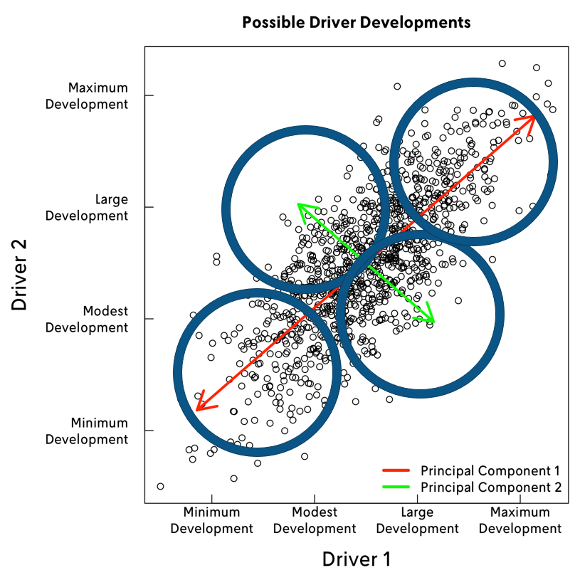
Figure 3: A two-dimensional example of four scenarios picked by PCA
Interpretation and visualisation
As a result of the computation, we get a numerical value for each uncertainty in each scenario. These vary on the scale from minimum to maximum. By combining these values, we get an interpretable state of the future. These values can also be visualised in many ways, such as the spiderweb format shown below. It presents all uncertainty values on a scale from minimum to maximum in a polygon. All resulting polygons can also be compiled on top of each other as on the right side figure to visualise the diversity of the resulting scenarios.
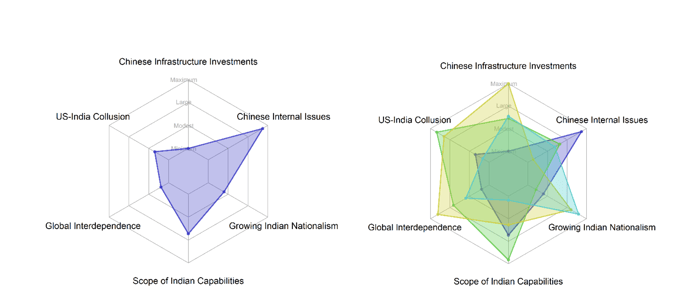 Figure 4: Spiderweb visualisation of the scenarios
The analysis process of PCA
In a nutshell, the analysis process of PCA goes as follows:
- Selection of the topic, timeframe, and research question to understand how the main trend is evolving, what the strongest drivers are, and which factors bring uncertainty regarding the future development of the topic.
- Identification and prioritisation of the most relevant or impactful uncertainties. Instead of too general things, focus instead on the uncertainties that can truly ‘divide the tides’ on the topic. An internal review process is recommended at this step to identify the final 6-10 uncertainties.
- Assessing correlations between uncertainties using quantitative data whenever possible and/or quantified Delphi estimates. The correlations are combined into a symmetric correlation table. An internal review process is recommended here as well.
- Computation of principal components with PCA algorithm and the resulting uncertainty values.
- Interpretation and visualisation of the values, e.g. into a spiderweb or another easily readable format.
- Assessment and compilation of impacts of the actualised states of the uncertainties into a coherent storyline – what is maximally strong and what is at its minimum in that particular scenario?
- Building the final scenario narratives and development paths that are grounded in given values of the uncertainties (e.g. the spiderweb). Participatory ideation of coherent logic of the storyline, and relevant events and timings for the development path. Iterative narrative writing and an internal review process are recommended here.
 Figure 5: Example of a final scenario narrative
Contact your Customer Success Manager or email us at support@futuresplatform.com for more information about the PCA method, and how to utilise it in your foresight work.
Reference to the method:
Aalto, Eljas & Kuosa, Tuomo (2023). How Principal Component Analysis (PCA) Can Improve the Modelling and Usage of the Scenario Method? In review process for journal: Technological Forecasting and Social Change